

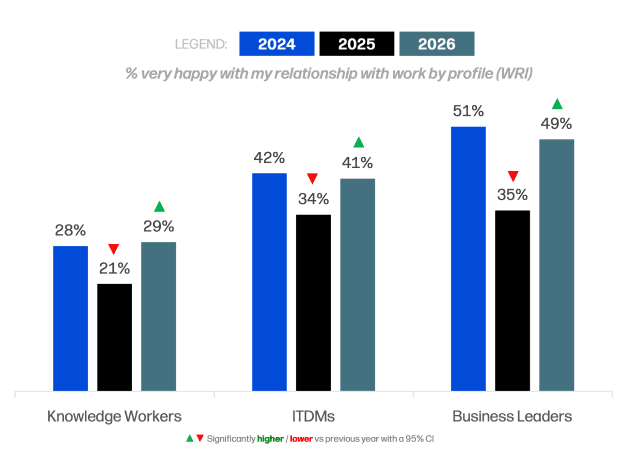
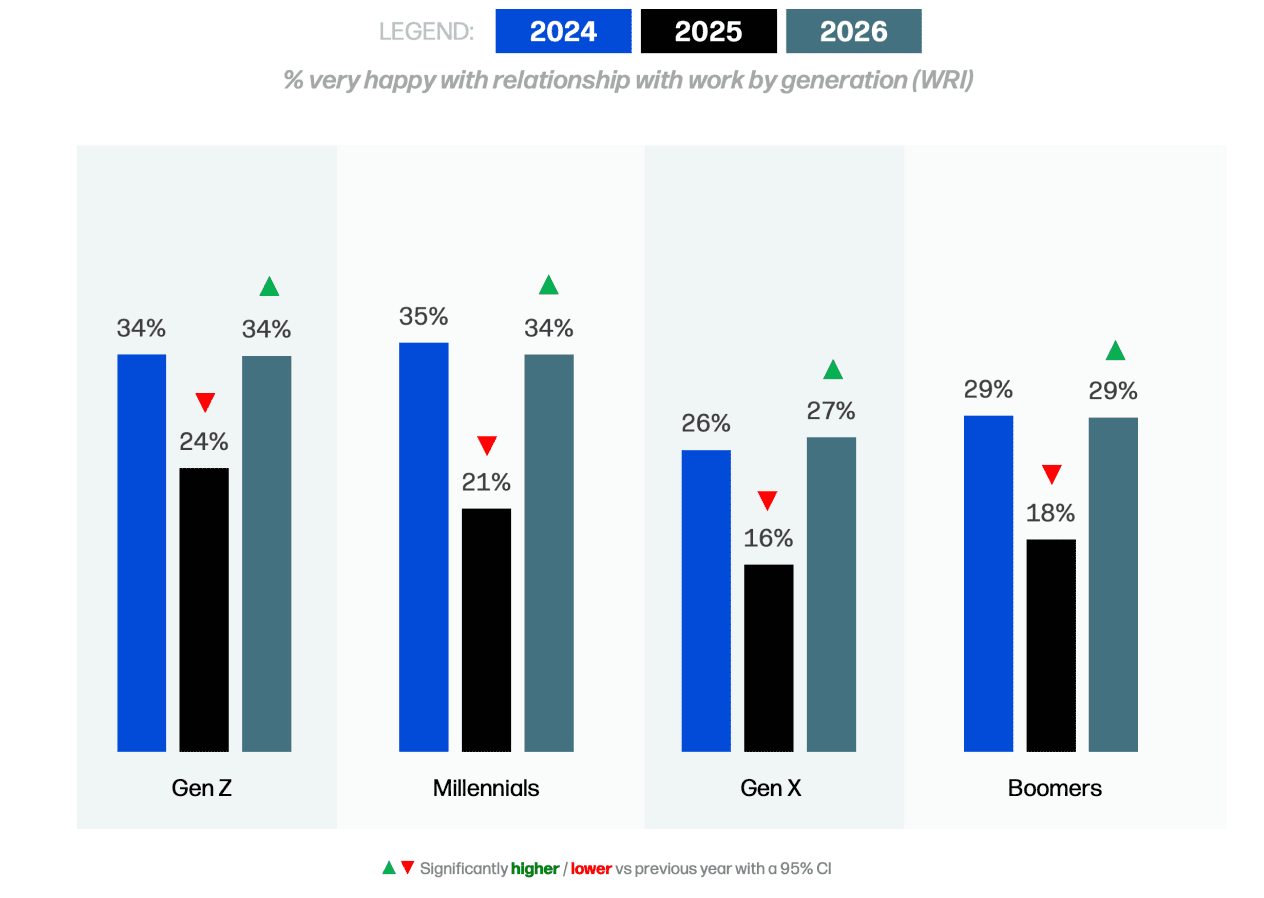
After a difficult 2025, workplace health has broadly returned to 2024 levels. 29% of Knowledge Workers now report a healthy relationship with work, up from 21% last year. However, one in three (35%) are in the Critical Zone.
WRI scores are calculated by asking survey respondents to evaluate how happy they are in their relationship with work on a 5-point scale. Healthy Zone = 5, Watch-Out Zone = 4, Critical Zone = 1 to 3

This improvement in workplace health is seen across all profiles studied by HP. But Business Leaders (49%) and ITDMs (41%) continue to report meaningfully healthier relationships with work than Knowledge Workers (29%), a consistent gap that suggests a structural divide in workplace health.
Emerging markets continue to set the pace for workplace health.
India (46%), Mexico, and Saudi Arabia (40% each) lead on workplace health, while momentum is strongest in India and Mexico.
In developed markets, the US is in the lead with a WRI score of 32%, though it still trails almost every emerging market. Among developed markets, Japan (13%) and Canada (20%) have the lowest share of Knowledge Workers with a healthy relationship with work.
While there are many factors shaping this divide, technology adoption is certainly a crucial one. Emerging markets consistently lead in AI adoption and are more positive about its impact on work.

In developed and emerging markets alike, we see the same factors underlying improved relationships with work. Leadership confidence and technology enablement are key influencers of WRI scores.
Trust in leadership may be the single biggest lever, but workers looking to adapt to continued change also need the right tools and skills, as well as confidence in how AI is being introduced into their organizations.
Metrics impacting WRI

The % figures represent the relative importance of each category in contributing to WRI scores.
 Organizational Confidence
Trust in the organization, leadership, and employee commitment.
 Technology Enablement
Access to technology and tools that support productivity and performance.
 Workforce Development
Company investment in employee growth, learning, and career development.
 Skills & Future Readiness
Confidence in skills and ability to adapt to future workplace demands.
 AI Confidence
Trust in AI adoption and belief in its potential workplace benefits.
Ultimately, improvements in WRI scores matter because business performance and healthy work relationships reinforce a virtuous cycle of growth.
Workers at high-performing companies are around six times more likely to have a healthy relationship with work than those at poorly performing companies (55% vs. 8%). This shows that investing in the factors leaders can control such as leadership, technology, and skills can support both healthier workplaces and stronger growth.


There’s been a strong recovery in workplace health relative to 2025.
This recovery, however, is best read as evidence of adaptation in progress. Disruption still shapes the modern workplace, but leaders are starting to manage the 85% of factors they can control. Using the levers of trust, technology, skills, and clarity, they are helping workers navigate uncertainty more effectively.