|
On June 6, 2006, HP issued a press release announcing that it had upwardly revised its earnings for its second fiscal quarter ended April 30, 2006 and its diluted earnings per share forecast for its fiscal year ending October 31, 2006. These revisions relate to the signing of a settlement agreement by the Internal Revenue Service resolving federal income tax matters for HP's 1996 through 1998 fiscal years. The information included on this page has not been updated to reflect the revised second quarter results or the revised diluted earnings per share expectations. The June 6, 2006 press release and updated financial information reflecting the revised second quarter results and the revised diluted earnings per share expectations are available immediately below. The original financial information released on May 16, 2006 is available at the bottom of the page.
» View press release and updated financial information
» View updated earnings presentation
HP Reports Second Quarter 2006 Results
- Net revenue of $22.6 billion, up 5% year-over-year, or 8% when adjusted for the effects of currency
- GAAP operating profit of $1.7 billion, or $0.51 earnings per share, up from $0.33 in the prior year period
- Non-GAAP operating profit of $1.8 billion, or $0.54 earnings per share, up from $0.37 in the prior year period
- Cash flow from operations of $3.6 billion
PALO ALTO, Calif., May 16, 2006 - HP today announced financial results for its second fiscal quarter ended April 30, 2006, with net revenue of $22.6 billion, representing growth of 5% year-over-year, or 8% when adjusted for the effects of currency. GAAP operating profit was $1.7 billion and GAAP diluted earnings per share (EPS) was $0.51 per share, up from $0.33 in the prior year period.
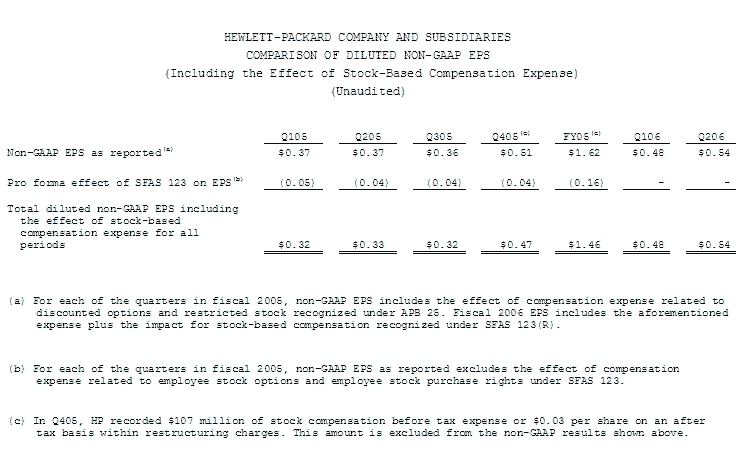
Non-GAAP operating profit was $1.8 billion, with non-GAAP diluted EPS of $0.54, up from $0.37 in the prior year period. Non-GAAP financial information excludes $97 million of adjustments on an after-tax basis, or $0.03 per diluted share, related primarily to amortization of purchased intangibles. GAAP and non-GAAP financial information include stock-based compensation expense in the current financial period only.
"HP delivered another solid quarter," said Mark Hurd, HP chief executive officer and president. "We grew revenue, expanded margins and generated record cash flow. At the same time, we continued to remain focused on executing our strategy and investing in the company's long-term success."
 |
Q2 FY06 |
Q2 FY05 |
Y/Y |
|
| Net Revenue ($B) |
$22.6 |
$21.6 |
5% |
|
| GAAP Operating Margin |
7.3% |
5.4% |
1.9 pts |
| GAAP net income ($B) |
$1.5 |
$1.0 |
51% |
| GAAP diluted EPS |
$0.51 |
$0.33 |
55% |
|
| Non-GAAP operating margin |
8.0% |
6.1% |
1.9 pts |
| Non-GAAP net income ($B) |
$1.6 |
$1.1 |
45% |
| Non-GAAP diluted EPS |
$0.54 |
$0.37 |
46% |
Information about HP's use of non-GAAP financial information is provided under "Use of non-GAAP financial information" below.
During the quarter, on a year-over-year basis, revenue in the Americas grew 10% to $9.7 billion, revenue in Europe, the Middle East and Africa declined 2% to $9.0 billion, and revenue in Asia Pacific grew 7% to $3.9 billion. When adjusted for the effects of currency, revenue in Europe, the Middle East and Africa grew 6%, and revenue in Asia Pacific grew 10%.
Personal Systems Group
Personal Systems Group (PSG) revenue grew 10% year-over-year to $7.0 billion, with unit shipments up 16%. On a year-over-year basis, desktop revenue increased 1% and notebook revenue grew 27%. Commercial client revenue grew 3% year-over-year, while Consumer client revenue increased 24%. Operating profit was $248 million, or 3.6% of revenue, up from a profit of $147 million, or 2.3% of revenue, in the prior year period.
Imaging and Printing Group
Imaging and Printing Group (IPG) revenue grew 5% year-over-year to $6.7 billion. On a year-over-year basis, supplies revenue grew 10%, commercial hardware revenue grew 4% and consumer hardware revenue declined 8%. Momentum in key growth initiatives continued, with color laser printer shipments and printer-based MFP shipments up 38% and 44% year-over-year, respectively. HP Indigo Press printed page volume grew 42% over the prior year period. Operating profit was $1.0 billion, or 15.5% of revenue, up from a profit of $814 million, or 12.7% of revenue, in the prior year period.
Enterprise Storage and Servers
Enterprise Storage and Servers (ESS) reported revenue of $4.3 billion, up 2% over the prior year period. On a year-over-year basis, industry-standard server revenue increased 4%, with blade revenue growth of 60%. Networked storage revenue grew 8%, led by continued strength in external arrays, where high-end XP revenue grew 8% and revenue in the mid-range EVA line increased 46%. Business critical systems revenue declined 7%, as Integrity systems growth of 93% was offset by declines in PA-RISC and Alpha. Operating profit was $322 million, or 7.5% of revenue, up from a profit of $180 million, or 4.3% of revenue, in the prior year period.
HP Services
HP Services (HPS) revenue declined 2% year-over-year to $3.9 billion. On a year-over-year basis, revenue in Technology Services declined 4%, Consulting and Integration revenue declined 2% and Managed Services revenue grew 2%. Excluding the effects of currency, HPS revenue grew 2% year-over-year. Operating profit was $345 million, or 8.9% of revenue, up from a profit of $292 million, or 7.3% of revenue, in the prior year period.
Software
Software revenue was $330 million, an increase of 20% year-over-year, with revenue in HP OpenView and HP OpenCall increasing 25% and 11%, respectively. HP OpenView growth was led by solid momentum associated with the recently completed acquisition of Peregrine Systems, Inc., which added key asset and service management components to the HP OpenView portfolio. Operating profit was $3 million, or 0.9% of revenue, compared with a loss of $2 million in the prior year period.
Financial Services
HP Financial Services (HPFS) reported revenue of $518 million, a decrease of 5% year-over-year. Finance volume decreased 14% over the prior year period, and net portfolio assets grew 1%. Operating profit was $39 million, or 7.5% of revenue, down from a profit of $58 million, or 10.7% of revenue, in the prior year period.
Asset management
Inventory ended the quarter at $6.8 billion, up $37 million sequentially and $304 million year-over-year. Accounts receivable increased $1.1 billion sequentially and $517 million over the prior year period to $9.8 billion. HP's dividend payment of $0.08 per share in the second quarter resulted in cash usage of $226 million. HP utilized $1.3 billion of cash during the second quarter to repurchase approximately 40 million shares of common stock. In addition, HP received approximately 7 million shares of common stock under the company's prepaid variable share purchase program. HP exited the quarter with $14.1 billion in gross cash, which includes cash and cash equivalents of $14.0 billion, short-term investments of $12 million, and certain long-term investments of $18 million.
Outlook
HP estimates Q3 FY06 revenue will be approximately $21.750 billion, and full year FY06 revenue will be approximately $91.0 billion, in line with current analyst consensus expectations.
Third quarter GAAP diluted EPS is expected to be in the range of $0.41 to $0.44, and non-GAAP diluted EPS is expected to be in the range of $0.45 to $0.48. Non-GAAP diluted EPS estimates exclude after-tax costs of approximately $0.04 per share, related primarily to the amortization of purchased intangible assets. Third quarter GAAP and non-GAAP diluted EPS estimates include $0.03 of stock-based compensation expense.
Full year GAAP diluted EPS expected to be in the range of $1.87 to $1.91, and full year FY06 non-GAAP diluted EPS is expected to be in the range of $2.04 to $2.08. Full year FY06 non-GAAP diluted EPS estimates exclude after-tax costs of approximately $0.17 per share, related primarily to the amortization of purchased intangible assets. Full year FY06 non-GAAP and GAAP diluted EPS estimates include $0.13 of stock-based compensation expense.
More information on HP's quarterly earnings, including additional financial analysis and an earnings overview presentation, is available on HP's Investor Relations website at http://www.hp.com/hpinfo/investor/.
HP's Q2 FY06 earnings conference call is accessible via an audio webcast at http://www.hp.com/hpinfo/investor/financials/quarters/2006/q2webcast.html.
About HP
HP is a technology solutions provider to consumers, businesses and institutions globally. The company's offerings span IT infrastructure, global services, business and home computing, and imaging and printing. For the four fiscal quarters ended April 30, 2006, HP revenue totaled $88.9 billion. More information about HP (NYSE, Nasdaq: HPQ) is available at http://www.hp.com.
Use of Non-GAAP Financial Information
To supplement HP's consolidated condensed financial statements presented on a GAAP basis, HP provides non-GAAP operating profit, non-GAAP operating margin, non-GAAP net income, non-GAAP diluted earnings per share and gross cash. HP also provides forecasts of non-GAAP diluted earnings per share.
Non-GAAP operating profit, non-GAAP operating margin, non-GAAP net income and non-GAAP diluted earnings per share are defined to exclude the effects of restructuring charges, charges relating to the amortization of intangible assets, in-process research and development charges and gains or losses on investments. Gross cash is a non-GAAP measure that is defined as GAAP cash and cash equivalents plus GAAP short-term investments and certain long-term investments that may be liquidated within 90 days pursuant to the terms of existing put options or similar rights. A reconciliation of adjustments to GAAP results for this quarter, fiscal year-to-date, and prior periods is included in the tables below.
HP's management uses non-GAAP operating profit, non-GAAP operating margin, non-GAAP net income and non-GAAP diluted earnings per share to evaluate and forecast HP's baseline performance before gains, losses or other charges that are considered by management to be outside of HP's core business segment operating results. Gross cash is considered to be a liquidity measure and provides useful information to management about the amount of cash available for investment in HP's businesses, funding strategic acquisitions, repurchasing stock and other purposes. Each of these non-GAAP measures is among the primary indicators management uses as a basis for planning and forecasting future periods. HP's management believes that these non-GAAP measures provide both management and investors with a more complete understanding of the underlying operating results and trends and an enhanced overall understanding of HP's financial performance, liquidity and prospects for the future.
This additional non-GAAP financial information is not meant to be considered in isolation or as a substitute for operating profit, operating margin, net income, diluted earnings per share, or cash and cash equivalents prepared in accordance with GAAP. In addition, there may be limitations associated with the use of these non-GAAP financial measures. For example, items such as restructuring charges that are excluded from non-GAAP operating profit, non-GAAP operating margin, non-GAAP net income and non-GAAP diluted earnings per share can have a material impact on cash flows. In addition, there may be restrictions on our ability to liquidate the long-term investments included in gross cash, which may limit the usefulness of gross cash as a liquidity measure. These effects are reflected in HP's GAAP financial statements, including HP's consolidated statements of cash flows. The non-GAAP financial information that HP has provide also may differ from the non-GAAP financial information provided by other companies.
Forward-Looking Statements
This news release contains forward-looking statements that involve risks, uncertainties and assumptions. If the risks or uncertainties ever materialize or the assumptions prove incorrect, the results of HP may differ materially from those expressed or implied by such forward-looking statements and assumptions. All statements other than statements of historical fact are statements that could be deemed forward-looking statements, including but not limited to any projections of revenue, margins, expenses, charges, earnings or other financial items; any statements of the plans, strategies, and objectives of management for future operations, including execution of any restructuring plans; any statements concerning the expected development, performance or market share relating to products or services; any statements of expectation or belief; and any statements of assumptions underlying any of the foregoing. Risks, uncertainties and assumptions include macroeconomic and geopolitical trends and events; execution and performance of contracts by suppliers, customers and partners; employee management issues; the challenge of managing asset levels, including inventory; the difficulty of aligning expense levels with revenue changes; assumptions related to pension and other post-retirement costs; and other risks that are described from time to time in HP's Securities and Exchange Commission reports, including but not limited to the risks described in HP's Annual Report on Form 10-K for the fiscal year ended October 31, 2005, HP's Quarterly Report on Form 10-Q for the fiscal quarter ended January 31, 2006 and other reports filed after that report. As in prior quarters, the financial information set forth in this release, including tax-related items, are estimates based on information available at this time. While HP believes these estimates to be meaningful, these amounts could differ materially from actual reported amounts in HP's Quarterly Report on Form 10-Q for the fiscal quarter ended April 30, 2006. In particular, determining HP's actual tax balances and provisions as of April 30, 2006 and for the fiscal quarter then ended requires extensive internal and external review of tax data (including consolidating and reviewing the tax provisions of numerous domestic and foreign entities) which is being completed in the ordinary course of preparing HP's Form 10-Q. HP assumes no obligation and does not intend to update these forward-looking statements.
|