|
View, print or save an Adobe Acrobat PDF file of this document. To view the PDF file, you need to have Adobe Acrobat Reader installed on your computer. Acrobat Reader is a free plug-in. You can download the latest version or download a version with accessibility features.
An audio webcast of the earnings conference call is available for one year.
- Net revenue of $22.7 billion, up 6% year-over-year, or 8% in constant currency
- Non-GAAP operating profit of $1.7 billion, $0.48 earnings per share
- GAAP operating profit of $1.5 billion, $0.42 earnings per share
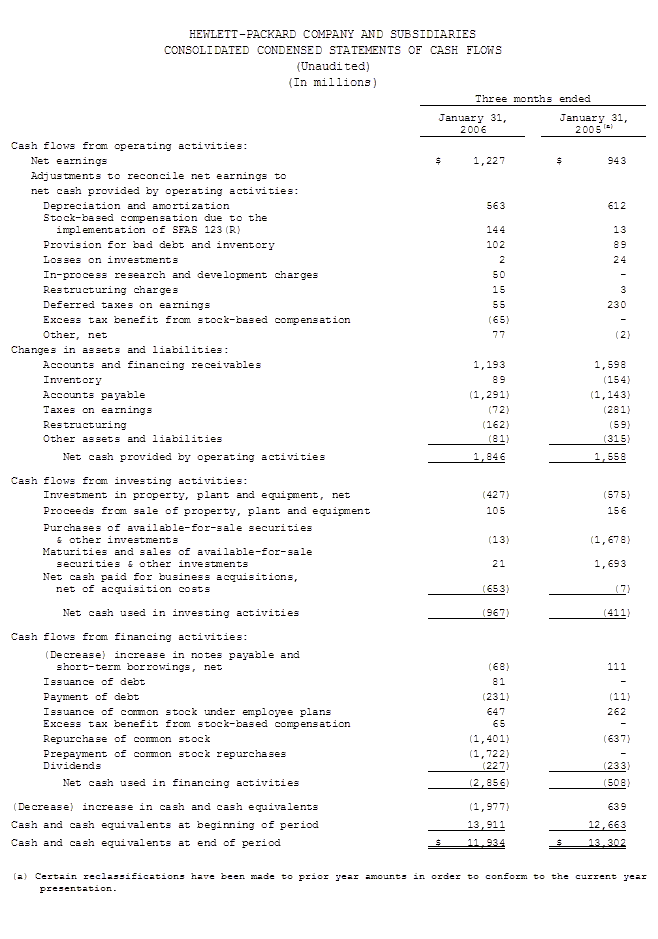
- Cash flow from operations of $1.8 billion
PALO ALTO, Calif., Feb. 15, 2006 - HP today reported financial results for its first fiscal quarter ended Jan. 31, 2006, with net revenue of $22.7 billion, an increase of 6% year-over-year, or 8% in constant currency. Non-GAAP operating profit(1) was $1.7 billion, with non-GAAP diluted earnings per share (EPS)(1) of $0.48 (includes stock based compensation expense), up from $0.37 in the prior-year period. Non-GAAP financial information for the first quarter excludes $166 million of adjustments on an after-tax basis, or $0.06 per diluted share, related primarily to amortization of purchased intangibles, and in-process research and development-related costs. GAAP operating profit was $1.5 billion and GAAP diluted EPS was $0.42 per share, up from $0.32 in the prior-year period.
"We are continuing to deliver on our plan to strengthen HP and better serve our customers," said Mark Hurd, HP chief executive officer and president. "Growth was balanced across most of our businesses and geographies, cash flow was strong and we were disciplined in controlling costs. While hard work remains ahead of us, our efforts are starting to show results."
 |
Q1 FY06 |
Q1 FY05 |
Y/Y |
| Net Revenue ($B) |
$22.7 |
$21.5 |
6% |
| Non-GAAP operating margin(1) |
7.5% |
6.2% |
|
| GAAP Operating Margin |
6.6% |
5.4% |
|
| Non-GAAP net income (1) ($B) |
$1.4 |
$1.1 |
29% |
| GAAP net income (1) ($B) |
$1.2 |
$0.9 |
30% |
| Non-GAAP diluted EPS (1) |
$0.48 |
$0.37 |
30% |
| GAAP diluted EPS |
$0.42 |
$0.32 |
31% |
During the quarter, on a year-over-year basis, revenue in the Americas grew 10% to $9.7 billion, Europe, the Middle East and Africa grew 1% to $9.4 billion, and Asia Pacific grew 6% to $3.5 billion.
Personal Systems Group
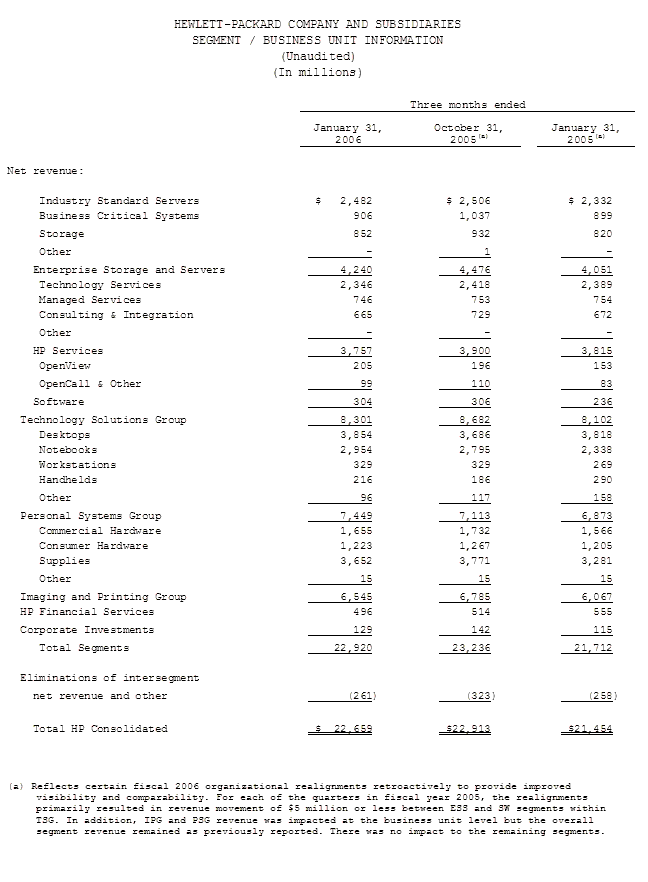
Personal Systems Group (PSG) revenue grew 8% year-over-year to $7.4 billion, with unit shipments up 16%. On a year-over-year basis, desktop revenue increased 1% and notebook revenue grew 26%. Commercial PC revenue grew 6% year-over-year, while Consumer PC revenue increased 18%. PSG reported an operating profit of $293 million, or 3.9% of revenue, up from a profit of $147 million, or 2.1% of revenue, in the prior-year period.
Imaging and Printing Group
Imaging and Printing Group (IPG) posted quarterly revenue of $6.5 billion, up 8% year-over-year. On a year-over-year basis, consumer hardware revenue increased 1%, led by All-in-One unit growth of 20%. Commercial hardware revenue grew 6%, with unit shipments of color laser printers up 36% and printer-based MFP shipments up 40%. Supplies revenue grew 11%. Operating profit was $973 million, or 14.9% of revenue, up from a profit of $932 million, or 15.4% of revenue, in the prior-year period.
Enterprise Storage and Servers
Enterprise Storage and Servers (ESS) reported revenue of $4.2 billion, up 5% over the prior-year period. On a year-over-year basis, industry-standard server revenue increased 6%, networked storage revenue grew 4% and business-critical systems revenue grew 1%. ESS reported an operating profit of $326 million, or 7.7% of revenue, up from a profit of $69 million, or 1.7% of revenue, in the prior-year period.
HP Services
HP Services (HPS) revenue declined 2% year-over-year to $3.8 billion. On a year-over-year basis, Technology Services revenue declined 2%, while Managed Services and Consulting and Integration declined 1% each. Excluding the effects of currency, HPS revenue grew 3% year-over-year. Operating profit was $293 million, or 7.8% of revenue, up from a profit of $281 million, or 7.4% of revenue, in the prior-year period.
Software
Software reported quarterly revenue of $304 million, an increase of 29% year-over-year, with revenue in HP OpenView and HP OpenCall increasing 34% and 19%, respectively. During the quarter, HP closed the acquisition of Peregrine Systems, Inc., which adds key asset and service management components to the HP OpenView portfolio. Software reported an operating profit of $9 million, or 3.0% of revenue, compared with a loss of $38 million in the prior-year period.
Financial Services
HP Financial Services (HPFS) reported revenue of $496 million, a decrease of 11% year-over-year. Finance volume and net portfolio assets declined 10% and 2% respectively. Operating profit was $38 million, or 7.7% of revenue, down from a profit of $45 million, or 8.1% of revenue, in the prior-year period.
Asset management
Inventory ended the quarter at $6.7 billion, down $146 million sequentially and down $389 million year-over-year. Accounts receivable decreased $1.2 billion sequentially and increased $14 million over the prior-year period to $8.7 billion. HP's dividend payment of $0.08 per share in the first quarter resulted in cash usage of $227 million. HP utilized $1.4 billion of cash during the first quarter to repurchase stock. During the quarter, HP entered into a $1.7 billion prepaid forward variable share repurchase program with a third-party investment bank to limit HP's exposure to share price volatility for repurchases made under the program during an approximate one-year period. In addition, the board of directors of HP has authorized an additional $4 billion for future repurchases of its outstanding shares of common stock. The company intends to offset dilution from the issuance of shares under employee benefit plans, as well as to use the authorization to repurchase shares opportunistically. HP exited the quarter with $12.0 billion in gross cash,(2) which includes cash and cash equivalents of $11.9 billion and short- and certain long-term investments of $30 million.
Outlook
HP estimates Q2 FY06 revenue will be in the range of $22.4 billion to $22.6 billion, with non-GAAP diluted earnings per share expected to be in the range of $0.47 to $0.49.
On a GAAP basis, Q2 FY06 diluted earnings per share is expected to be in the range of $0.43 to $0.45.
Non-GAAP diluted earnings per share estimates exclude after-tax costs of approximately $0.04 per share, related primarily to the amortization of purchased intangible assets. Second quarter non-GAAP and GAAP diluted earnings per share include $0.03-$0.04 of stock-based compensation expense.
HP estimates full year FY06 revenue will be in the range of $90.0 billion to $91.0 billion, with full year non-GAAP diluted earnings per share expected to be in the range of $1.90 to $1.95.
On a GAAP basis, full year FY06 GAAP diluted earnings per share is expected to be in the range of $1.72 to $1.77.
Full year FY06 non-GAAP diluted earnings per share estimates exclude after-tax costs of approximately $0.18 per share, related primarily to the amortization of purchased intangible assets. Full year FY06 non-GAAP and GAAP diluted earnings per share includes $0.13 of stock-based compensation expense.
More information on HP's quarterly earnings, including additional financial analysis and an earnings overview presentation, is available on HP's Investor Relations website at http://www.hp.com/hpinfo/investor/.
HP's Q1 FY06 earnings conference call is accessible via an audio webcast at http://www.hp.com/hpinfo/investor/financials/quarters/2006/q1webcast.html.
About HP
HP is a technology solutions provider to consumers, businesses and institutions globally. The company's offerings span IT infrastructure, global services, business and home computing, and imaging and printing. For the four fiscal quarters ended Jan. 31, 2006, HP revenue totaled $87.9 billion. More information about HP (NYSE, Nasdaq: HPQ) is available at http://www.hp.com.
(1) Non-GAAP operating profit, non-GAAP operating margin, non-GAAP net income and non-GAAP diluted earnings per share are defined to exclude the effects of restructuring charges, charges relating to the amortization of intangible assets, in-process research and development charges and gains or losses on investments. A reconciliation of adjustments to GAAP results for this quarter and prior periods is included in the tables below. A description of HP's use of non-GAAP information is provided under "Use of Non-GAAP Financial Information."
(2) Gross cash is a non-GAAP measure that is defined as GAAP cash and cash equivalents plus GAAP short-term investments and certain long-term investments that may be liquidated within 90 days pursuant to the terms of existing put options or similar rights. As of Jan. 31, 2006 cash and cash equivalents amounted to $11.9 billion and short- and long-term investments included in gross cash amounted to $12 million and $18 million, respectively.
Use of non-GAAP financial information
To supplement HP's consolidated condensed financial statements presented on a GAAP basis, HP provides non-GAAP operating profit, non-GAAP operating margin, non-GAAP net income, non-GAAP diluted earnings per share and gross cash. HP also provides forecasts of non-GAAP diluted earnings per share.
HP's management uses non-GAAP operating profit, non-GAAP operating margin, non-GAAP net income and non-GAAP diluted earnings per share to evaluate and forecast HP's baseline performance before gains, losses or other charges that are considered by management to be outside of HP's core business segment operating results. Gross cash is considered to be a liquidity measure and provides useful information to management about the amount of cash available for investment in HP's businesses, funding strategic acquisitions, repurchasing stock and other purposes. Each of these non-GAAP measures is among the primary indicators management uses as a basis for planning and forecasting future periods. We believe that these non-GAAP measures provide both management and investors with a more complete understanding of the underlying operating results and trends and an enhanced overall understanding of HP's financial performance, liquidity and prospects for the future.
This additional non-GAAP information is not meant to be considered in isolation or as a substitute for operating margin, net income, diluted earnings per share or cash and cash equivalents prepared in accordance with GAAP. Reconciliations of these non-GAAP financial measures to the most directly comparable GAAP financial measures are included in the attached tables. In addition, there may be limitations associated with the use of these non-GAAP financial measures. For example, items such as restructuring charges that are excluded from non-GAAP operating profit, non-GAAP operating margin, non-GAAP net income and non-GAAP diluted earnings per share can have a material impact on cash flows. In addition, there may be restrictions on our ability to liquidate the long-term investments included in gross cash, which may limit the usefulness of gross cash as a liquidity measure. These effects are reflected in our GAAP financial statements, including our consolidated statements of cash flows. The non-GAAP financial information that we provide also may differ from the non-GAAP information provided by other companies.
Forward-looking statements
This news release contains forward-looking statements that involve risks, uncertainties and assumptions. If the risks or uncertainties ever materialize or the assumptions prove incorrect, the results of HP may differ materially from those expressed or implied by such forward-looking statements and assumptions. All statements other than statements of historical fact are statements that could be deemed forward-looking statements, including but not limited to any projections of revenue, margins, expenses, charges, earnings or other financial items; any statements of the plans, strategies, and objectives of management for future operations, including execution of any restructuring plans; any statements concerning the expected development, performance or market share relating to products or services; any statements of expectation or belief; and any statements of assumptions underlying any of the foregoing. Risks, uncertainties and assumptions include macroeconomic and geopolitical trends and events; execution and performance of contracts by suppliers, customers and partners; employee management issues; the challenge of managing asset levels, including inventory; the difficulty of aligning expense levels with revenue changes; assumptions related to pension and other post-retirement costs; expectations and assumptions relating to the execution and timing of workforce restructuring programs; and other risks that are described from time to time in HP's Securities and Exchange Commission reports, including but not limited to the risks described in HP's Annual Report on Form 10-K for the fiscal year ended Oct. 31, 2005 and other reports filed after that report. As in prior quarters, the financial information set forth in this release, including tax-related items, are estimates based on information available at this time. While HP believes these estimates to be meaningful, these amounts could differ materially from actual reported amounts in HP's Quarterly Report on Form 10-Q for the fiscal quarter ended Jan. 31, 2006. In particular, determining HP's actual tax balances and provisions as of Jan. 31, 2006 and for the fiscal quarter then ended requires extensive internal and external review of tax data (including consolidating and reviewing the tax provisions of numerous domestic and foreign entities), which is being completed in the ordinary course of preparing HP's Form 10-Q. HP assumes no obligation and does not intend to update these forward-looking statements.
|