|
View, print or save an Adobe Acrobat PDF file of this document. To view the PDF file, you need to have Adobe Acrobat Reader installed on your computer. Acrobat Reader is a free plug-in. You can download the latest version or download a version with accessibility features.
An audio webcast of the earnings conference call is available for one year.
- Record quarterly revenue of $21.6 billion, up 7% year-over-year
- Non-GAAP operating profit of $1.3 billion, $0.37 earnings per share
- GAAP operating profit of $1.2 billion, $0.33 earnings per share
- Cash flow from operations of $2.4 billion
PALO ALTO, Calif., May. 17, 2005 - HP today reported financial results for its second fiscal quarter ended April 30, 2005. Second quarter revenue increased 7% year-over-year to $21.6 billion.
Non-GAAP(1) operating profit was $1.3 billion, with non-GAAP diluted earnings per share (EPS) of $0.37, up from $0.34 in the prior-year period. Non-GAAP diluted EPS and non-GAAP net earnings for the second quarter reflect a $107 million adjustment on an after-tax basis, or $0.04 per diluted share. GAAP operating profit for the second quarter was $1.2 billion. GAAP diluted EPS was $0.33 per share, up from $0.29 in the prior-year period.
 |
Q2 FY05 |
Q2 FY04 |
Y/Y |
| Revenue (billions) |
$21.6 |
$20.1 |
7% |
| Non-GAAP Operating Margin(1) |
6.1% |
6.7% |
|
| GAAP Operating Margin |
5.4% |
5.7% |
|
| Non-GAAP diluted EPS(1) |
$0.37 |
$0.34 |
9% |
| GAAP diluted EPS |
$0.33 |
$0.29 |
14% |
"HP had a solid quarter," said Mark Hurd, HP chief executive officer and president. "We grew revenue 7%, non-GAAP earnings per share rose 9% and we generated $2.4 billion in cash flow from operations.
"Nevertheless, our overall performance leaves room for improvement in many of our businesses. We expect to provide details as soon as our plans are finalized that will move us toward that objective."
During the quarter, on a year-over-year basis, revenue in Europe, the Middle East and Africa grew 10% to $9.1 billion, in Americas grew 4% to $8.8 billion and in Asia Pacific grew 9% to $3.6 billion. On a consolidated basis, when adjusted for the effects of currency, second quarter revenue grew 4% year-over-year.
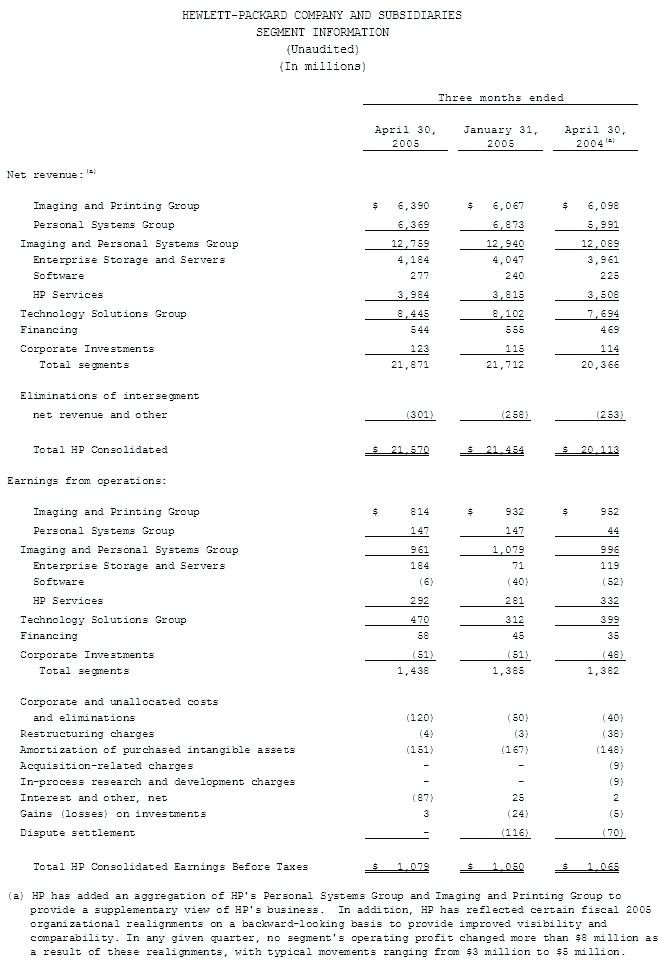
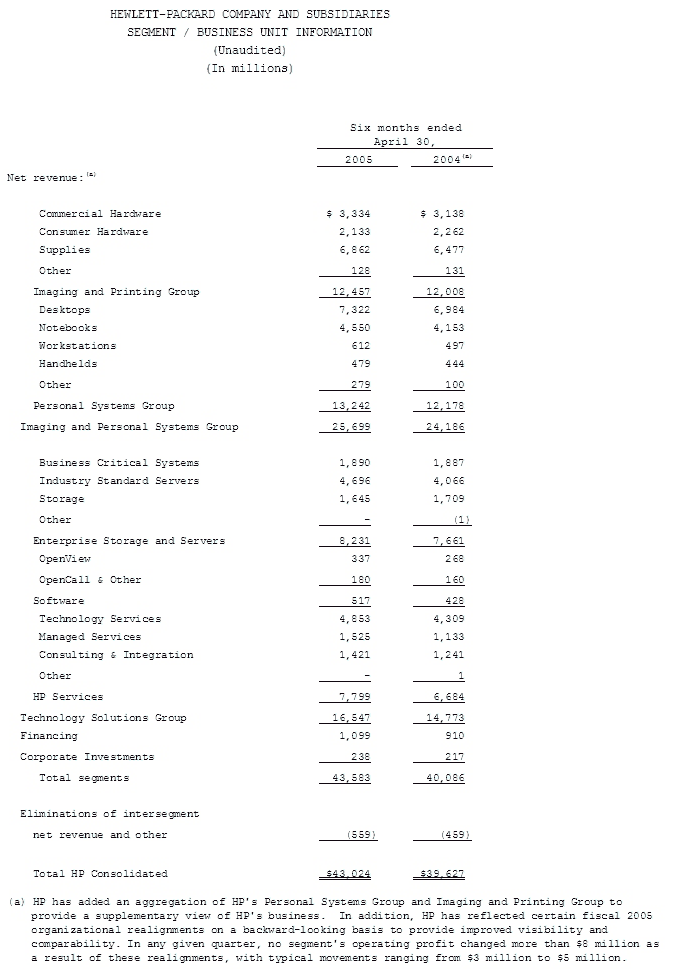
Personal Systems Group
Personal Systems Group (PSG) revenue grew 6% year-over-year to $6.4 billion, with unit shipments up 12%. On a year-over-year basis, desktop revenue increased 1% and notebook revenue grew 10%. Revenue for commercial clients, which includes workstations, grew 3% over the prior-year period, while consumer clients revenue grew 10%. PSG reported an operating profit of $147 million, or 2.3% of revenue, up from a profit of $44 million in the prior-year period.
Imaging and Printing Group
Imaging and Printing Group (IPG) posted quarterly revenue of $6.4 billion, up 5% year-over-year. On a year-over-year basis, consumer hardware revenue increased 3%, with unit shipments up 13%. Commercial hardware revenue grew 8%, with unit shipments up 12%. Color laser unit shipments increased 96% year-over-year and MFP shipments increased 61%, reflecting continued momentum in key growth initiatives. Supplies revenue grew 4%. Operating profit was $814 million, or 12.7% of revenue, down from a profit of $952 million in the prior-year period. This reflects $71 million in workforce reduction costs, hardware pricing actions, hardware growth and mix shifts within supplies.
Enterprise Storage and Servers
Enterprise Storage and Servers (ESS) reported revenue of $4.2 billion, up 6% over the prior-year period. On a year-over-year basis, industry-standard server revenue increased 12%, business-critical systems (BCS) revenue grew 2% and networked storage revenue was down 6%. Within BCS, revenue in HP Integrity servers grew 37% year-over-year and HP-UX revenue grew 9%. ESS reported operating profit of $184 million, or 4.4% of revenue, up from a profit of $119 million in the prior-year period. Included in the quarterly results is $24 million in workforce reduction costs.
HP Services
HP Services (HPS) revenue grew 14% year-over-year to $4.0 billion. On a year-over-year basis, Managed Services revenue grew 27%, Technology Services grew 11% and Consulting and Integration grew 10%. Operating profit was $292 million, or 7.3% of revenue, down from a profit of $332 million in the prior-year period. Included in the quarterly results is $74 million in workforce reduction costs.
Software
Software reported quarterly revenue of $277 million, an increase of 23% year-over-year, with revenue in HP OpenView and HP OpenCall increasing 36% and 4%, respectively. Software reported an operating loss of $6 million, compared with a loss of $52 million in the prior-year period.
Financial Services
HP Financial Services (HPFS) reported revenue of $544 million, up 16% year-over-year. Finance volume, a leading indicator of future revenue, grew 4% over the prior-year period, and net portfolio assets grew 2% year-over-year to $7.1 billion. Operating profit was $58 million, or 10.7% of revenue, up from a profit of $35 million in the prior-year period.
Asset management
Inventory ended the quarter at $6.5 billion, down $656 million sequentially and up $191 million year-over-year. Accounts receivable increased $601 million sequentially and $736 million over the prior-year period to $9.3 billion. HP's dividend payment of $0.08 per share in the second quarter resulted in cash usage of $233 million. In addition, HP utilized $618 million of cash during the second quarter in connection with stock repurchases. HP exited the quarter with $14.5 billion in gross cash, which includes cash and cash equivalents of $14.4 billion and short- and certain long-term investments of $0.1 billion.
Outlook
HP estimates Q3 FY05 revenue will be in the range of $20.3 billion to $20.7 billion, with non-GAAP earnings per share in the range of $0.29 to $0.31. This excludes after-tax costs of approximately $0.03 per share from amortization of purchased intangible assets and approximately $100 million, or $0.03 per share, in workforce reductions.
More information on HP's quarterly earnings, including additional financial analysis and an earnings overview presentation, is available on HP's Investor Relations website at http://www.hp.com/hpinfo/investor/.
HP's Q2 FY05 earnings conference call is accessible via an audio webcast at http://www.hp.com/hpinfo/investor/financials/quarters/2005/q2webcast.html.
About HP
HP is a technology solutions provider to consumers, businesses and institutions globally. The company's offerings span IT infrastructure, global services, business and home computing, and imaging and printing. For the four fiscal quarters ended April 30, 2005, HP revenue totaled $83.3 billion. More information about HP (NYSE, Nasdaq: HPQ) is available at http://www.hp.com.
(1) All non-GAAP numbers have been adjusted to exclude certain items. A reconciliation of specific adjustments to GAAP results for this quarter and the prior periods is included in the table below titled: "Non-GAAP Consolidated Condensed Statements of Earnings." A description of HP's use of non-GAAP information is provided under "Use of Non-GAAP Financial Information."
Use of Non-GAAP Financial Information
To supplement HP's consolidated condensed financial statements presented on a GAAP basis, HP uses non-GAAP additional measures of operating results, net earnings and earnings per share adjusted to exclude certain costs, expenses, gains or losses it believes appropriate to enhance an overall understanding of HP's past financial performance and also its prospects for the future. These adjustments to HP's GAAP results are made with the intent of providing both management and investors a more complete understanding of the underlying operational results and trends and the company's marketplace performance. For example, the non-GAAP results are an indication of HP's baseline performance before gains, losses or other charges that are considered by management to be outside of the company's core business segment operational results. In addition, these non-GAAP results are among the primary indicators management uses as a basis for planning and forecasting future periods. The presentation of this additional information is not meant to be considered in isolation or as a substitute for net earnings or diluted earnings per share prepared in accordance with generally accepted accounting principles in the United States.
Forward-Looking Statements
This press release contains forward-looking statements that involve risks, uncertainties and assumptions. If the risks or uncertainties ever materialize or the assumptions prove incorrect, the results of HP may differ materially from those expressed or implied by such forward-looking statements and assumptions. All statements other than statements of historical fact are statements that could be deemed forward-looking statements, including but not limited to any projections of earnings, revenue, expenses, cash repatriation, margins or other financial items; any statements of the plans, strategies, and objectives of management for future operations, including execution of any restructuring plans and remediation of execution issues; any statements concerning the expected development, performance or market share relating to products or services; any statements regarding future economic conditions or performance; any statements of expectation or belief; and any statements of assumptions underlying any of the foregoing. Risks, uncertainties and assumptions include macroeconomic and geopolitical trends and events; the outcome of pending legislation; execution and performance of contracts by suppliers, customers and partners; employee management issues; the challenge of managing asset levels, including inventory; the difficulty of aligning expense levels with revenue changes; assumptions related to pension and other post-retirement costs; and other risks that are described from time to time in HP's Securities and Exchange Commission reports, including but not limited to the risks described in HP's Quarterly Report on Form 10-Q for the fiscal quarter ended January 31, 2005 and other reports filed after HP's Annual Report on Form 10-K for the fiscal year ended October 31, 2004 . HP assumes no obligation and does not intend to update these forward-looking statements.
|