|
View, print or save an Adobe Acrobat PDF file of this document. To view the PDF file, you need to have Adobe Acrobat Reader installed on your computer. Acrobat Reader is a free plug-in. You can download the latest version or download a version with accessibility features.
An audio webcast of the earnings conference call is available for a limited time.
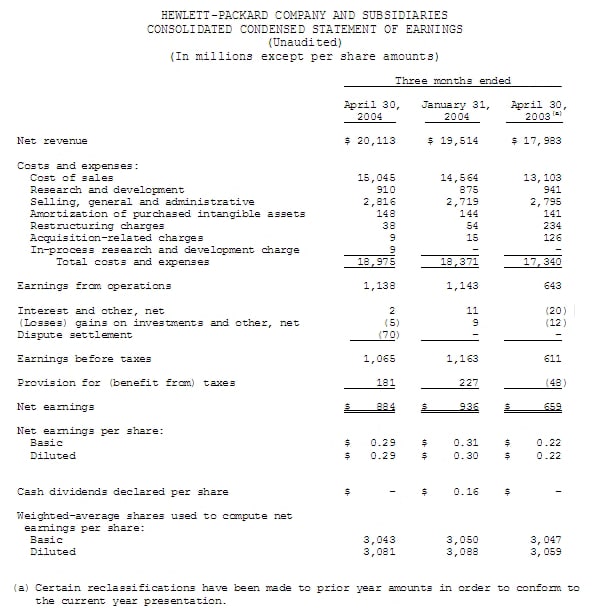
- Record revenue of $20.1 billion, up 12% year-over-year
- Non-GAAP operating profit of $1.3 billion, up 17% year-over-year; Non-GAAP EPS $0.34, up 17% year-over-year
- GAAP operating profit of $1.1 billion, up 77% year-over-year; GAAP EPS $0.29, up 32% year-over-year
- Both Non-GAAP and GAAP earnings include a $70 million charge for HP's settlement with the Canadian government
- Revenue in Personal Systems grew 17% year-over-year; HP Services grew 15%; Imaging and Printing grew 11%;
Enterprise Storage and Servers grew 8%; Software grew 23%
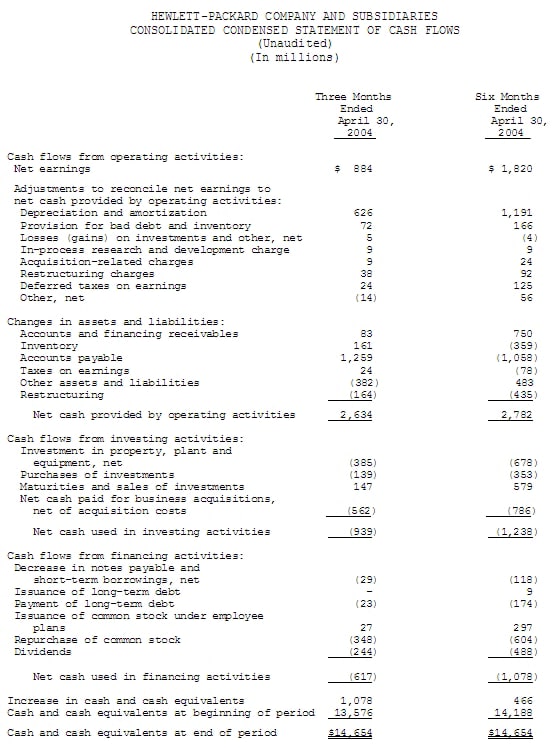
- Cash flow from operations totaled $2.6 billion
PALO ALTO, Calif., May 18, 2004 - HP today reported financial results for its second fiscal quarter ended April 30, 2004, including record revenue of $20.1 billion, an increase of 12% year-over-year.
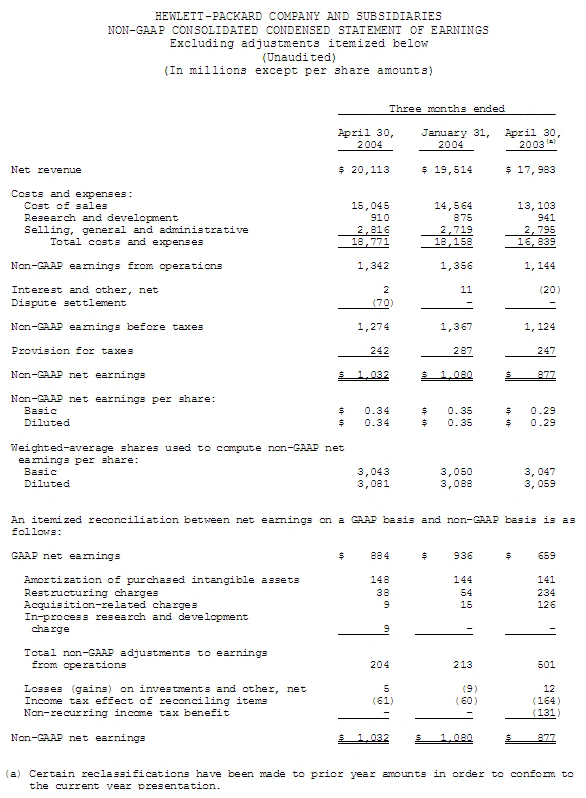
Non-GAAP(1) operating profit was $1.3 billion for the quarter, an increase of 17% year-over-year. Non-GAAP diluted earnings per share (EPS) was $0.34 for the quarter, up 17% from $0.29 last year. Non-GAAP diluted EPS and non-GAAP net earnings include a $148 million adjustment on an after-tax basis, or $0.05 per diluted share.
GAAP operating profit for the quarter was $1.1 billion, an improvement of $495 million or 77% year-over-year. GAAP diluted EPS was $0.29 per share, up 32% from $0.22 year-over-year.
On May 13, HP Canada agreed to reimburse the Government of Canada $105 million in U.S. dollars. This settlement, net of a previously recorded amount of $35 million, had an impact of approximately 2 cents per share on second quarter GAAP and non-GAAP earnings.
All non-GAAP financial information in this release is reconciled in the table below titled, "Non-GAAP Consolidated Condensed Statement of Earnings."
 |
Q2 FY04 |
Y/Y Growth |
Q2 FY03 |
| Revenue (billions) |
$20.1 |
12% |
$18.0 |
| Non-GAAP Operating Margin(1) |
6.7% |
|
6.4% |
| GAAP Operating Margin |
5.7% |
|
3.6% |
| Non-GAAP diluted EPS(1) |
$0.34 |
17% |
$0.29 |
| GAAP diluted EPS |
$0.29 |
32% |
$0.22 |
During the quarter, and on a year-over-year basis, revenue in the Americas grew 4% to $8.4 billion; Europe grew 17% to $8.3 billion; Asia Pacific grew 22% to $2.4 billion; and Japan grew 21% to $967 million. On a total company basis, and when adjusted for the effects of currency, second quarter revenue grew 4% year-over-year.
"HP delivered a strong quarter with solid revenue gains and continued profitability across the portfolio. We surpassed $20 billion in quarterly revenue for the first time in our history, with record second quarter revenue in PCs, enterprise hardware, software, services and imaging and printing. Cash flow from operations totaled $2.6 billion. These results demonstrate that we are winning and growing across the portfolio in an intensely competitive market," said Carly Fiorina, HP chairman and chief executive officer.
Technology Solutions Group
The Technology Solutions Group consists of Enterprise Storage and Servers, Software and HP Services. The group reported revenue of $7.7 billion, up 11% from the prior year period, with each business reporting record quarterly revenue in the second quarter. Operating profit for the quarter totaled $400 million, up $108 million year-over-year.
Enterprise Storage and Servers
Enterprise Storage and Servers reported revenue of $4.0 billion, up 8% year-over-year, led by 15% growth in Industry Standard Servers, which posted record revenue and unit growth of 32%. HP Superdome server orders and shipments achieved another quarterly record. Revenue in Intel® Itanium®-based HP Integrity servers almost doubled sequentially.
Storage revenue totaled $897 million for the quarter, down 1% year-over-year, but up 7% sequentially. Strength in the high-end XP platforms and storage software was offset by discounting in the midrange and continuing declines in tape revenue.
Operating profit for the quarter totaled $120 million, a $62 million year-over-year improvement, but down $34 million sequentially reflecting mix shifts within the businesses, strength in HP ProLiant server revenue and aggressive pricing.
Software
Software reported record quarterly revenue of $222 million, an increase of 23% year-over-year. HP OpenCall revenue increased 43% over the prior year period. HP OpenView revenue increased 15% year-over-year. Software reported an operating loss of $49 million, as the company continues to make strategic investments that support the HP Adaptive Enterprise strategy.
HP Services
HP Services revenue grew 15% year-over-year to $3.5 billion. This represents record quarterly revenue and the highest quarterly revenue growth since the merger. Managed services grew 50% over the prior year period. Revenue in customer support grew 9% and consulting and integration revenue increased 8% year-over-year. Operating profit was $329 million, or 9.4% of revenue, down from 9.8% in the prior year period, but up 1.2 points sequentially reflecting improvements in Customer Support and Consulting and Integration margins.
Personal Systems
Personal Systems revenue totaled $6.0 billion, up 17% year-over-year, with strong growth across all regions and categories. Desktop revenue increased 14% year-over-year, while notebooks grew 26%. This is the third consecutive quarter that PC year-over-year revenue growth surpassed HP's nearest competitor. Personal Systems reported an operating profit of $45 million, up from $23 million in the prior year period.
Imaging and Printing
Imaging and Printing posted record second quarter revenue of $6.1 billion, up 11% year-over-year. During the quarter HP shipped approximately 1 million printer units a week, bringing total shipments to more than 310 million units worldwide. Supplies grew 15% over the prior year period, and business hardware grew 10%. Home hardware revenue declined 4% year-over-year as a 38% increase in all-in-one unit shipments was offset by declining sales of single-function printers and scanners. Investments in high-growth printing categories such as digital photography, total print management services and digital publishing continued to gain traction. Operating profit of $953 million was also a second quarter record and represented 15.6% of revenue.
Financial Services
Revenue was $469 million, down 6% year-over-year but up 6% sequentially. Operating profit was $35 million, increased from $21 million in the prior year period, and represented 7.5% of revenue, the highest level since the merger.
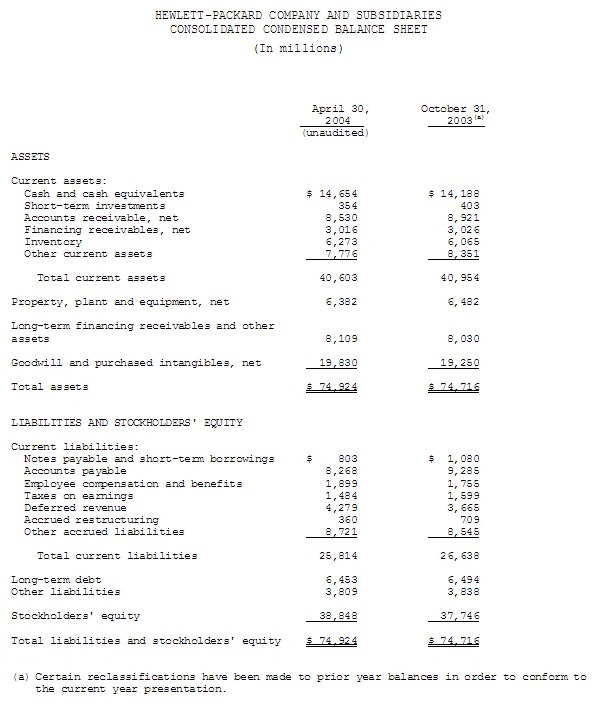
Asset Management
Cash generated from operations for the quarter was approximately $2.6 billion after $164 million in cash payments related to restructuring. HP exited the quarter with $15.1 billion in gross cash, which includes cash and cash equivalents of $14.7 billion and short- and certain long-term investments of approximately $400 million. Inventory ended the quarter at $6.3 billion, down $214 million from the prior quarter and up $530 million year-over-year. Trade receivables increased $209 million from the prior quarter to $8.5 billion. HP's dividend payment of $0.08 per share in the second quarter resulted in a cash use of $244 million. In addition, HP repurchased $348 million of stock and paid $562 million in net cash for acquisitions during the second quarter.
Outlook
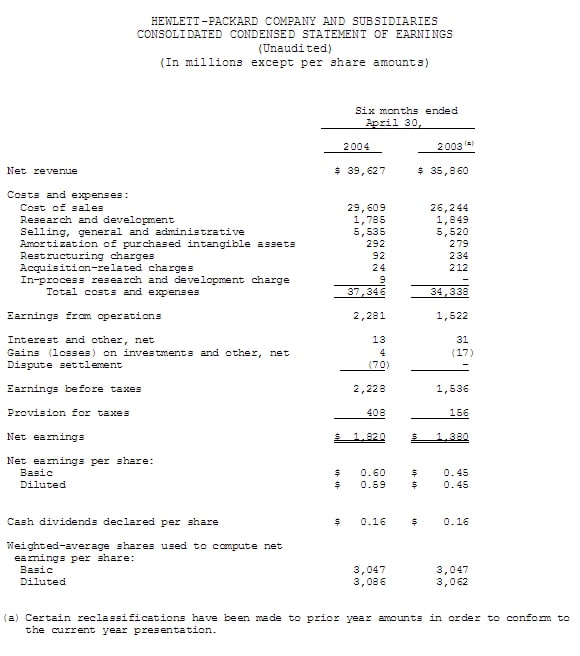
HP is raising its second half 2004 revenue estimates to a range of $39.7 billion to $40.7 billion. Current analyst estimates are $39.7 billion. HP is also confirming second half non-GAAP earnings per share of $0.74.
The non-GAAP EPS expectations assume after-tax exclusion for second half charges of approximately $0.08 per share from amortization of purchased intangible assets and acquisition-related charges.
More information on this quarter's earnings is available on HP's Investor Relations site at http://www.hp.com/hpinfo/investor/financials/quarters/index.html.
About HP
HP is a technology solutions provider to consumers, businesses and institutions globally. The company's offerings span IT infrastructure, personal computing and access devices, global services and imaging and printing. For the four fiscal quarters ended April 30, 2004, HP revenue totaled $76.8 billion. More information about HP (NYSE, Nasdaq: HPQ) is available at http://www.hp.com.
(1) All non-GAAP numbers have been adjusted to exclude certain items. A reconciliation of specific adjustments to GAAP results for this quarter and the prior period is included in the table below titled: "Non-GAAP Consolidated Condensed Statement of Earnings." A description of HP's use of non-GAAP information is provided under "Use of Non-GAAP Financial Information."
Intel and Itanium are registered trademarks of Intel Corp. or its subsidiaries in the United States and other countries.
Use of Non-GAAP Financial Information
To supplement the company's consolidated condensed financial statements presented on a GAAP basis, HP uses non-GAAP additional measures of operating results, net earnings and earnings per share adjusted to exclude certain costs, expenses, gains and losses it believes appropriate to enhance an overall understanding of HP's past financial performance and also its prospects for the future. These adjustments to HP's GAAP results are made with the intent of providing both management and investors a more complete understanding of the underlying operational results and trends and the company's marketplace performance. For example, the non-GAAP results are an indication of HP's baseline performance before gains, losses or other charges that are considered by management to be outside of the company's core business segment operational results. In addition, these adjusted non-GAAP results are among the primary indicators management uses as a basis for planning and forecasting of future periods. The presentation of this additional information is not meant to be considered in isolation or as a substitute for net earnings or diluted earnings per share prepared in accordance with generally accepted accounting principles in the United States.
Forward-Looking Statements
This press release contains forward-looking statements that involve risks and uncertainties, as well as assumptions that if they ever materialize or prove incorrect, could cause the results of HP and its consolidated subsidiaries to differ materially from those expressed or implied by such forward-looking statements and assumptions. All statements other than statements of historical fact are statements that could be deemed forward-looking statements, including but not limited to any projections of earnings, revenue, margins, synergies or other financial items; any statements of the plans, strategies, and objectives of management for future operations, including the execution of integration and restructuring plans; any statements concerning proposed new products, services, developments, anticipated performance of products or services, or industry rankings; any statements regarding future economic conditions or performance; any statements of belief; and any statements of assumptions underlying any of the foregoing. The risks, uncertainties and assumptions referred to above include macroeconomic and geopolitical trends and events; intense competition within our industry; performance of contracts by suppliers, customers and partners; the possibility that proposed contracts may not be entered into or ultimately performed on the terms currently contemplated or at all; that the market for the sale of certain products and services may not develop as expected; that development and performance of products and services may not proceed as planned; employee management issues; the challenge of managing asset levels, including inventory; the difficulty of aligning expense levels with revenue changes; and other risks that are described from time to time in the Quarterly Report on Form 10-Q for the fiscal quarter ended Jan. 31, 2004, and other Securities and Exchange Commission reports, filed after the Annual Report on Form 10-K for the fiscal year ended Oct. 31, 2003. HP assumes no obligation and does not intend to update these forward-looking statements.
|